Hire the Top 2% of
Remote Data Visualization Developers
in Brazil
Your trusted source for hiring top Data Visualization developers, engineers, experts, programmers, freelancers, coders, contractors, and consultants in Brazil — Perfect for startups and enterprises.
Freelance contractors Full-time roles Global teams
514 Remote Data Visualization developers and experts available to hire:

Vetted Data Visualization developer in Brazil (UTC-3)
Skilled Data Scientist focusing on Computer Vision, MLOps, and providing the best solution to real-world problems. I successfully improved the company's ML workflow with automated training, evaluation, and dataset generation. Worked mainly with OCR and image classification models, acquiring knowledge of Deep Learning techniques for image generation, classification, and segmentation, besides other ML projects such as time-series forecasting. Built a real-time scalable ETL system on the cloud from scratch to automatically process billing information. Experienced in creating data visualizations and communicating technical ideas.

Remote Data Visualization developer in Brazil (UTC-3)
data analyst with expertise in business intelligence, data visualization, and ETL processes. over the past few years, I’ve developed dashboards and analytics solutions that help teams across tech, marketing and entertainment industries. with extensive experience in SQL, Python, Power BI, and Tableau, I've helped teams to insight and optimize strategies for global campaigns in latin america, new zealand, australia, and beyond. from generating 10,000+ qualified leads to building sentiment analysis tools for marketing campaigns, my experience across multiple fields in data and business is always on to achieve the best results. always on for a pint of beer, mug of coffee or cup of water.

Remote Data Visualization developer in Brazil (UTC-3)
Experienced 12 years full-stack developer, with a demonstrated history of working in the web industry. During my professional journey, as a full-stack developer, I had working on a couple of company that uses a couple of different technologies that helps me to improve my skills in different code languages and frameworks: Backend skills: - Strong expertise working with PHP 5/7 developer (CodeIgniter, Symfony 1.4, Laravel, Lumen) - Strong expertise building complex database queries on Oracle, SQL Server, PostgreSQL and MySQL, and also No-SQL such as MongoDB, Redis (for queues) - Strong expertise modeling database schema - Strong expertise working with Ruby on Rails - Intermediate expertise working with Ops stuff (able to build basic bash scripts/routines, executes some advanced commands and basic analyses like CPU, Memory, IO consumes and logs analyses in general) - Strong expertise working/building ETL and OLAP processing - Intermediate expertise building PL/SQL scripts - Strong expertise consuming soap & restful integrations - Strong expertise building restful integrations - Intermediate expertise building soap integrations - Strong expertise testing application with PHPUnit - Intermediate expertise testing application Ruby MiniTest & Capybara library - Ability to build simple routine/scripts with Python & GoLang language - MacOS/Linux, Docker, Git, VSCode, terminal(shell) Frontend skills: - Strong expertise working with Javascript in general, including ES6, and React.JS - Strong expertise building interface using HTML, CSS, Sass, JSX, Styled-Components, TailwindCSS and Bootstrap - Strong expertise building in-house Design System using React.JS + Material-UI library, building optimized react components - Strong expertise testing React/Javascript using Jest Skills in self-management, commitment, productivity, trust, organizational skills, autonomy, and fast learner. Lover for new technologies and enjoy learning new things.
Remote Data Visualization developer in Brazil (UTC-3)
I'm a software engineer with 6+ years of experience, being the latest focused primarily on the React ecosystem and Typescript. My favorite and current stack to work on includes Typescript, Next.js, React, TailwindCSS, Hasura. I have experience working on both early stage startups and big e-commerces and from web development to mobile apps. I like working with performant applications, interesting projects and cool people.

Remote Data Visualization developer in Brazil (UTC-3)
I specialize in Operations Research, Analytics, Generative AI and Data Science, applying and developing methods and tools to construct and identify optimal scenarios, with a focus on cost reduction, process improvement, and better resource allocation. I have advanced skills in Power BI, SQL, Excel, and Python. I have worked on projects in the following sectors: Railway Logistics, Mining, Food Industry, Oil and Gas, Basic Industry, Agribusiness, Healthcare, and Car Rental. My primary interest is in solving complex problems using analytical approaches in various contexts, leading technical and business teams to achieve satisfactory and value-generating results.

Vetted Data Visualization developer in Brazil (UTC-3)
Inquisitive, results-driven, and ambitious Business Intelligence Engineer ready to create a better and more efficient global community via technology and data-driven insights. Professional with over 5 years of proven track record of achieving best-in-class results. A visionary with expertise in the following: • Strategic planning • Requirement engineering for BI projects • ELT / ETL (Pentaho Data Integration, Azure Data Factory, Python) • Dimensional modeling (Kimball) • SQL databases (MS SQL Server, MySQL) • Basic knowledge of NoSQL (Mongo, Neo4J) • Basic knowledge of Hadoop (HDFS, YARN, MapReduce), Spark (PySpark, SQL), and Delta Lake • R / SQL / M / DAX / Python • GitHub • Statistical analysis (descriptive, inferential, probability) • Dataviz tools (Power BI, Data Studio, ggplot2, matplotlib) • Data Storytelling
Vetted Data Visualization developer in Brazil (UTC-3)
Technology professional with over 20 years of experience and an entrepreneur, I have worked on various projects across different business sectors, serving as a developer, analyst, and project manager. I founded my own company, where I developed an advanced platform for the corporate communications market. This venture provided me with valuable insights into areas such as marketing and sales, serving hundreds of clients. Additionally, I collaborate with international companies in the data field, from collection to final analysis. I have a special interest and expertise in data, with several relevant certifications such as AZ-900, DP-900, PL-300, and DP-203. My professional role involves structuring data for companies, including architecture, engineering, and data analysis. I have experience with technologies such as Azure, AWS, Power BI, SQL Server, MySQL, Snowflake, Python, DWs, and DevOps. Skills Data Engineering • SQL • Data Warehousing • Power BI • Business Analysis • Snowflake • Azure Data Factory • Databricks • Data Modeling • ETL/ELT • C# • Python Check my portfolio in [https://portfolio.sigeweb.com.br/](https://portfolio.sigeweb.com.br/)

Vetted Data Visualization developer in Brazil (UTC-3)
I am a dedicated Software Engineer with over 4 years of experience specializing in backend development. My expertise primarily lies in web development, where I leverage languages such as Python, Django, Flask, JavaScript and Docker to build robust, scalable applications.
Remote Data Visualization developer in Brazil (UTC-3)
AI, ML, and software development mentor with 10+ years of hands-on experience. Expert in [ Python, TensorFlow, React, etc.] and [ computer vision, natural language processing, etc.]. My methodology leverages empirically-validated learning frameworks that Fortune 500 executives and tech visionaries value. Rather than surface-level knowledge, you'll gain the strategic understanding and technical rationale that drives innovation—the same depth of insight that separates market leaders from followers. This isn't about code memorization; it's about mastering the decision architecture that powers technological advancement. I help developers and businesses with: - Solving complex technical challenges in real-world projects - Understanding advanced concepts in AI and software engineering - Accelerating professional growth with personalized feedback - Developing effective AI strategies aligned with business goals As a technical leader who has guided dozens of engineers and organizations through AI implementation, I can offer perspectives on both coding challenges and strategic decision-making in AI adoption.

Vetted Data Visualization developer in Brazil (UTC-3)
Data Scientist with a strong background in machine learning, data manipulation, and statistical analysis. Experienced in building predictive models, developing data-driven strategies, and communicating complex insights to diverse audiences. Passionate about leveraging data to drive decision-making and improve business outcomes.
Discover more freelance Data Visualization developers today
Why Arc to find a Data Visualization developer for hire

Access vetted Data Visualization developers
Meet dedicated Data Visualization developers who are fully vetted for domain expertise and English fluency.

View matches in seconds
Stop reviewing 100s of resumes. View Data Visualization developers instantly with HireAI.

Save with global hires
Get access to 450,000 talent in 190 countries, saving up to 58% vs traditional hiring.

Get real human support
Feel confident hiring Data Visualization developers with hands-on help from our team of expert recruiters.


Why clients hire Data Visualization developers with Arc


How to use Arc
1. Tell us your needs
Share with us your goals, budget, job details, and location preferences.
2. Meet top Data Visualization developers
Connect directly with your best matches, fully vetted and highly responsive.
- 3. Hire Data Visualization developers

Decide who to hire, and we'll take care of the rest. Enjoy peace of mind with secure freelancer payments and compliant global hires via trusted EOR partners.
Hire Top Remote
Data Visualization developers
in Brazil
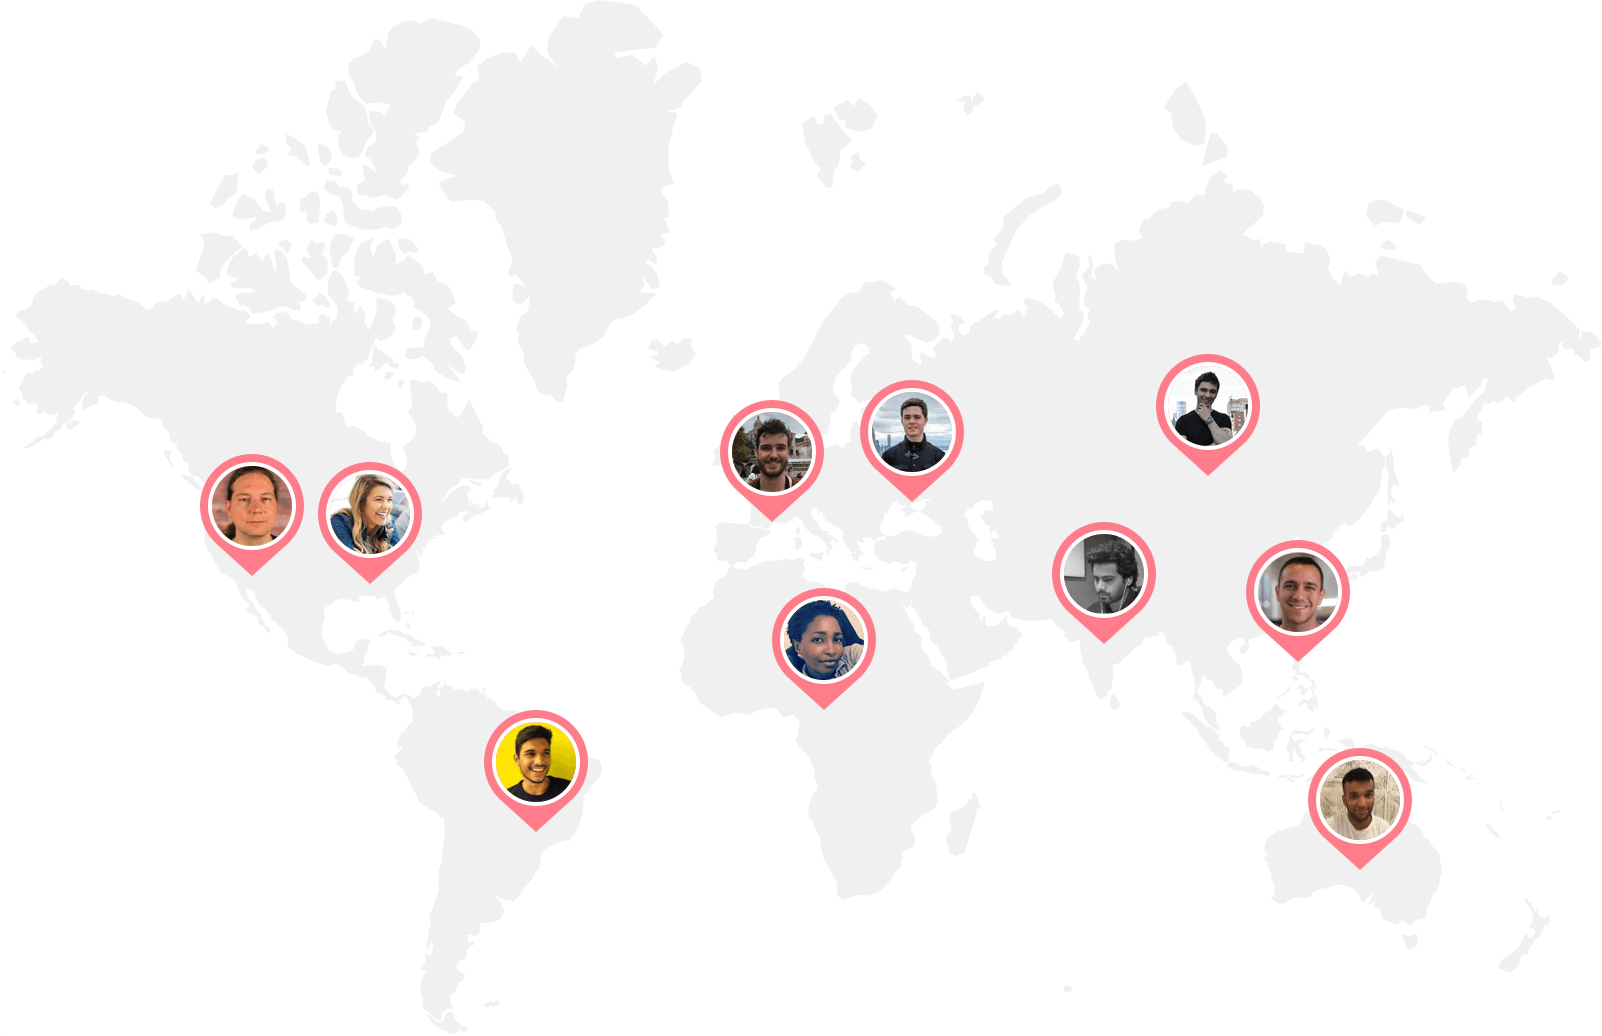
Arc talent
around the world
Arc Data Visualization developers
in Brazil
Ready to hire your ideal Data Visualization developers?
Get startedTop remote developers are just a few clicks away
Arc offers pre-vetted remote developers skilled in every programming language, framework, and technology. Look through our popular remote developer specializations below.
Find and hire developers by role / expertise
Find and hire engineers by skills
Build your team of Data Visualization developers anywhere
Arc helps you build your team with our network of full-time and freelance Data Visualization developers worldwide.
We assist you in assembling your ideal team of programmers in your preferred location and timezone.
FAQs
Why hire a Data Visualization developer?
In today’s world, most companies have code-based needs that require developers to help build and maintain. For instance, if your business has a website or an app, you’ll need to keep it updated to ensure you continue to provide positive user experiences. At times, you may even need to revamp your website or app. This is where hiring a developer becomes crucial.
Depending on the stage and scale of your product and services, you may need to hire a Data Visualization developer, multiple engineers, or even a full remote developer team to help keep your business running. If you’re a startup or a company running a website, your product will likely grow out of its original skeletal structure. Hiring full-time remote Data Visualization developers can help keep your website up-to-date.
How do I hire Data Visualization developers?
To hire a Data Visualization developer, you need to go through a hiring process of defining your needs, posting a job description, screening resumes, conducting interviews, testing candidates’ skills, checking references, and making an offer.
Arc offers three services to help you hire Data Visualization developers effectively and efficiently. Hire full-time Data Visualization developers from a vetted candidates pool, with new options every two weeks, and pay through prepaid packages or per hire. Alternatively, hire the top 2.3% of expert freelance Data Visualization developers in 72 hours, with weekly payments.
If you’re not ready to commit to the paid plans, our free job posting service is for you. By posting your job on Arc, you can reach up to 450,000 developers around the world. With that said, the free plan will not give you access to pre-vetted Data Visualization developers.
Furthermore, we’ve partnered with compliance and payroll platforms Deel and Remote to make paperwork and hiring across borders easier. This way, you can focus on finding the right Data Visualization developers for your company, and let Arc handle the logistics.
Where do I hire the best remote Data Visualization developers?
There are two types of platforms you can hire Data Visualization developers from: general and niche marketplaces. General platforms like Upwork, Fiverr, and Gigster offer a variety of non-vetted talents unlimited to developers. While you can find Data Visualization developers on general platforms, top tech talents generally avoid general marketplaces in order to escape bidding wars.
If you’re looking to hire the best remote Data Visualization developers, consider niche platforms like Arc that naturally attract and carefully vet their Data Visualization developers for hire. This way, you’ll save time and related hiring costs by only interviewing the most suitable remote Data Visualization developers.
Some factors to consider when you hire Data Visualization developers include the platform’s specialty, developer’s geographical location, and the service’s customer support. Depending on your hiring budget, you may also want to compare the pricing and fee structure.
Make sure to list out all of the important factors when you compare and decide on which remote developer job board and platform to use to find Data Visualization developers for hire.
How do I write a Data Visualization developer job description?
Writing a good Data Visualization developer job description is crucial in helping you hire Data Visualization developers that your company needs. A job description’s key elements include a clear job title, a brief company overview, a summary of the role, the required duties and responsibilities, and necessary and preferred experience. To attract top talent, it's also helpful to list other perks and benefits, such as flexible hours and health coverage.
Crafting a compelling job title is critical as it's the first thing that job seekers see. It should offer enough information to grab their attention and include details on the seniority level, type, and area or sub-field of the position.
Your company description should succinctly outline what makes your company unique to compete with other potential employers. The role summary for your remote Data Visualization developer should be concise and read like an elevator pitch for the position, while the duties and responsibilities should be outlined using bullet points that cover daily activities, tech stacks, tools, and processes used.
For a comprehensive guide on how to write an attractive job description to help you hire Data Visualization developers, read our Engineer Job Description Guide & Templates.
What skills should I look for in a Data Visualization developer?
The top five technical skills Data Visualization developers should possess include proficiency in programming languages, understanding data structures and algorithms, experience with databases, familiarity with version control systems, and knowledge of testing and debugging.
Meanwhile, the top five soft skills are communication, problem-solving, time management, attention to detail, and adaptability. Effective communication is essential for coordinating with clients and team members, while problem-solving skills enable Data Visualization developers to analyze issues and come up with effective solutions. Time management skills are important to ensure projects are completed on schedule, while attention to detail helps to catch and correct issues before they become bigger problems. Finally, adaptability is crucial for Data Visualization developers to keep up with evolving technology and requirements.
What kinds of Data Visualization developers are available for hire through Arc?
You can find a variety of Data Visualization developers for hire on Arc! At Arc, you can hire on a freelance, full-time, part-time, or contract-to-hire basis. For freelance Data Visualization developers, Arc matches you with the right senior developer in roughly 72 hours. As for full-time remote Data Visualization developers for hire, you can expect to make a successful hire in 14 days. To extend a freelance engagement to a full-time hire, a contract-to-hire fee will apply.
In addition to a variety of engagement types, Arc also offers a wide range of developers located in different geographical locations, such as Latin America and Eastern Europe. Depending on your needs, Arc offers a global network of skilled engineers in various different time zones and countries for you to choose from.
Lastly, our remote-ready Data Visualization developers for hire are all mid-level and senior-level professionals. They are ready to start coding straight away, anytime, anywhere.
Why is Arc the best choice for hiring Data Visualization developers?
Arc is trusted by hundreds of startups and tech companies around the world, and we’ve matched thousands of skilled Data Visualization developers with both freelance and full-time jobs. We’ve successfully helped Silicon Valley startups and larger tech companies like Spotify and Automattic hire Data Visualization developers.
Every Data Visualization developer for hire in our network goes through a vetting process to verify their communication abilities, remote work readiness, and technical skills. Additionally, HireAI, our GPT-4-powered AI recruiter, enables you to get instant candidate matches without searching and screening.
Not only can you expect to find the most qualified Data Visualization developer on Arc, but you can also count on your account manager and the support team to make each hire a success. Enjoy a streamlined hiring experience with Arc, where we provide you with the developer you need, and take care of the logistics so you don’t need to.
How does Arc vet a Data Visualization developer's skills?
Arc has a rigorous and transparent vetting process for all types of developers. To become a vetted Data Visualization developer for hire on Arc, developers must pass a profile screening, complete a behavioral interview, and pass a technical interview or pair programming.
While Arc has a strict vetting process for its verified Data Visualization developers, if you’re using Arc’s free job posting plan, you will only have access to non-vetted developers. If you’re using Arc to hire Data Visualization developers, you can rest assured that all remote Data Visualization developers have been thoroughly vetted for the high-caliber communication and technical skills you need in a successful hire.
How long does it take to find Data Visualization developers on Arc?
Arc pre-screens all of our remote Data Visualization developers before we present them to you. As such, all the remote Data Visualization developers you see on your Arc dashboard are interview-ready candidates who make up the top 2% of applicants who pass our technical and communication assessment. You can expect the interview process to happen within days of posting your jobs to 450,000 candidates. You can also expect to hire a freelance Data Visualization developer in 72 hours, or find a full-time Data Visualization developer that fits your company’s needs in 14 days.
Here’s a quote from Philip, the Director of Engineering at Chegg:
“The biggest advantage and benefit of working with Arc is the tremendous reduction in time spent sourcing quality candidates. We’re able to identify the talent in a matter of days.”
Find out more about how Arc successfully helped our partners in hiring remote Data Visualization developers.
How much does a freelance Data Visualization developer charge per hour?
Depending on the freelance developer job board you use, freelance remote Data Visualization developers' hourly rates can vary drastically. For instance, if you're looking on general marketplaces like Upwork and Fiverr, you can find Data Visualization developers for hire at as low as $10 per hour. However, high-quality freelance developers often avoid general freelance platforms like Fiverr to avoid the bidding wars.
When you hire Data Visualization developers through Arc, they typically charge between $60-100+/hour (USD). To get a better understanding of contract costs, check out our freelance developer rate explorer.
How much does it cost to hire a full time Data Visualization developer?
According to the U.S. Bureau of Labor Statistics, the medium annual wage for developers in the U.S. was $120,730 in May 2021. What this amounts to is around $70-100 per hour. Note that this does not include the direct cost of hiring, which totals to about $4000 per new recruit, according to Glassdoor.
Your remote Data Visualization developer’s annual salary may differ dramatically depending on their years of experience, related technical skills, education, and country of residence. For instance, if the developer is located in Eastern Europe or Latin America, the hourly rate for developers will be around $75-95 per hour.
For more frequently asked questions on hiring Data Visualization developers, check out our FAQs page.